Before finding potential property for a residential project, it is necessary to find a perfect location for it. There are many attributes from market development to socio-demographic insights to be taken into consideration when evaluating areas.
How you evaluate potential locations with CHAOS dashboards:
- Find suitable plots for development or redevelopment
- Further sharpen the list of found opportunities by understanding residential market pulse
1. Find suitable plots for development or redevelopment
See our use case called “Find a plot that meets your criteria” for a step-by-step guide on how to find a suitable plot for your project.
2. Further sharpen the list of found opportunities by understanding residential market pulse
Next we are going through steps that help you dig deeper into the residential market and make decisions based on insights.
2.a. Discover the growth rate of demand and supply
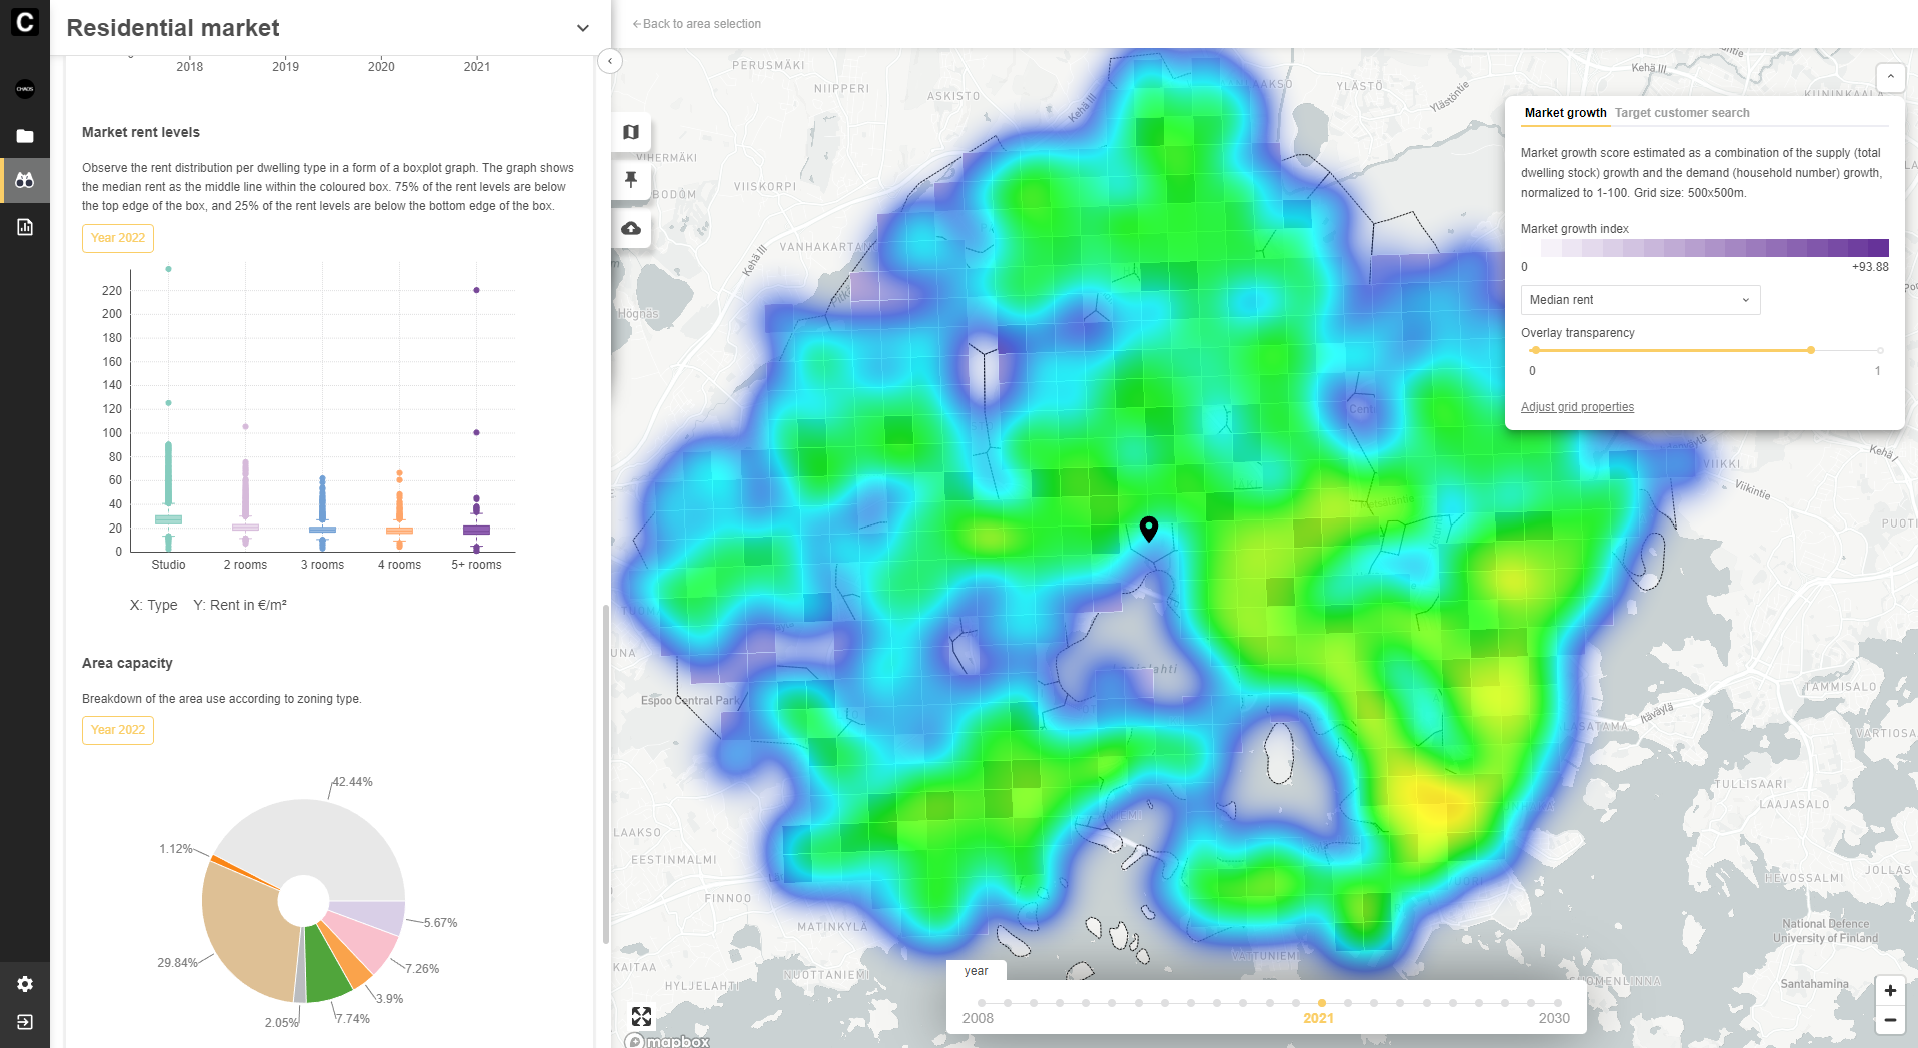
With CHAOS market growth score you can quickly locate areas of growth both in dwellings and residents. This step helps you select the areas for further analysis.
2.b. Look at rent levels and prices by types of dwellings and properties and market activity
Find out the rent differences in the macro-market and analyse how rents correspond with areas of active residential growth.

With market rent levels, you can observe the rent distribution per dwelling type in a form of a boxplot graph. The graph shows the median rent as the middle line within the coloured box.
2.c. Examine the dwelling production and households of the selected areas in detail
With the Residential market dashboard, you can find a breakdown of residential demand and supply drivers such as
- household structure and
- dwelling stock
2.d. Analyse dwelling mix and approximate occupancy levels measured once a year
Understand property mix and occupancy levels in selected areas. Take a look at how different types of residential property are represented in the area. Find out the number of occupied dwellings and the total available housing supply. What type of property would fit here best?
