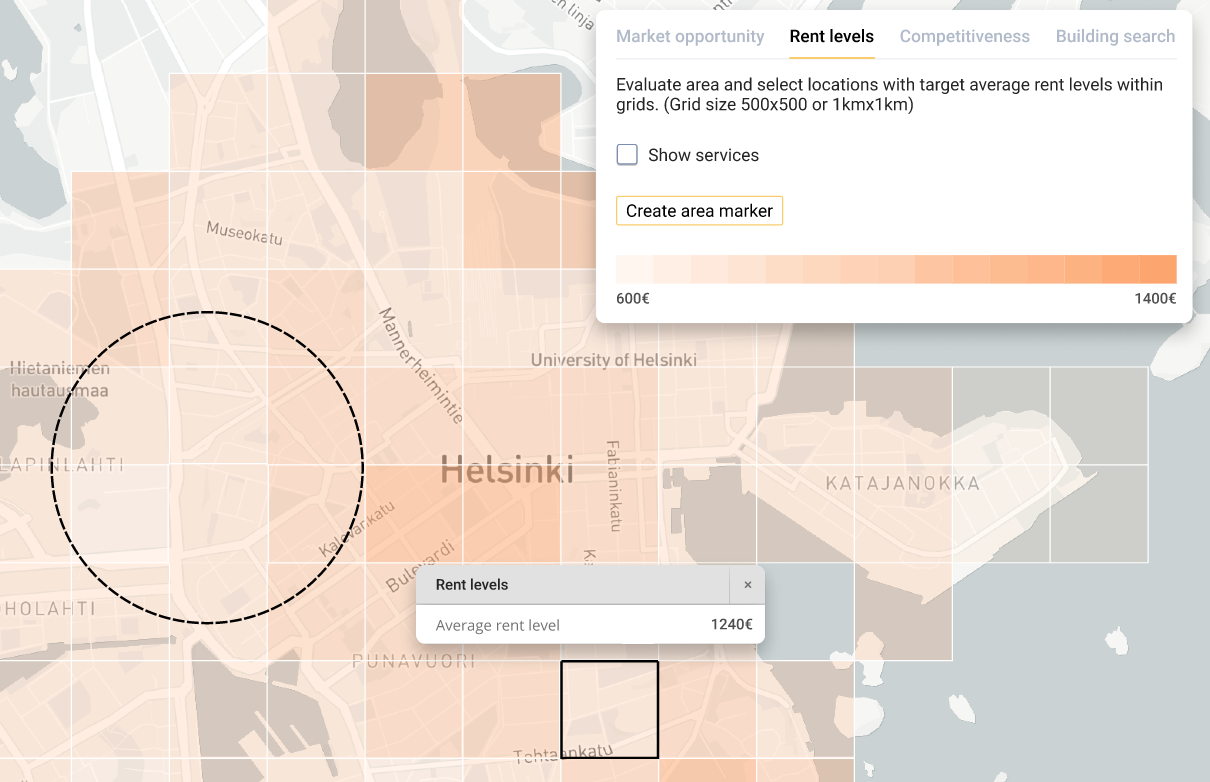
This use case provides an overview of how CHAOS dashboards can be applied in a market analysis for investment decisions in the residential market.
Overview
Traditionally investment decisions have focused on limited data such as the transactions, information on property owners, or the type of investment. However, today there is additional information that can be analysed together to better understand the performance of specific locations.
At the heart of CHAOS, we believe that insights driven by demand, in other words, people, provide more accurate predictions and forecasts. This use case provides a quick overview of how CHAOS can help you better understand the investment market through:
- AI-driven forecasts;
- Fast insights;
- Integrated and high-quality data
Screening the market through CHAOS dashboards
CHAOS dashboards provide a map-based interface to carry out a solid market analysis by considering demand-supply balance indicators.
There are at least five insights that can be applied when using CHAOS license for investment purposes:
- Demographic forecasts and population density;
- Economic environment (unemployment rate, income level);
- Area investments (construction activities, their types, mixed-use);
- Market performance (rental prices);
- Location benefits
1. Demographic forecasts and population density
The housing demand of a specific location can be estimated more accurately when considering not only the current demographic situation but also the demographic forecasts.
CHAOS provides a wide range of demographic forecasts, including forecasts on age, gender, income, unemployment rate, generation cohort. The forecasts give the first glance of how the future demand might look like.

By looking into additional insights such as generation groups and population density you receive a more accurate overview of how the population is distributed. The population density shows where and how the population is concentrated in the city and, combined with insights on area investments, it enhances understanding of the direction of the city growth.
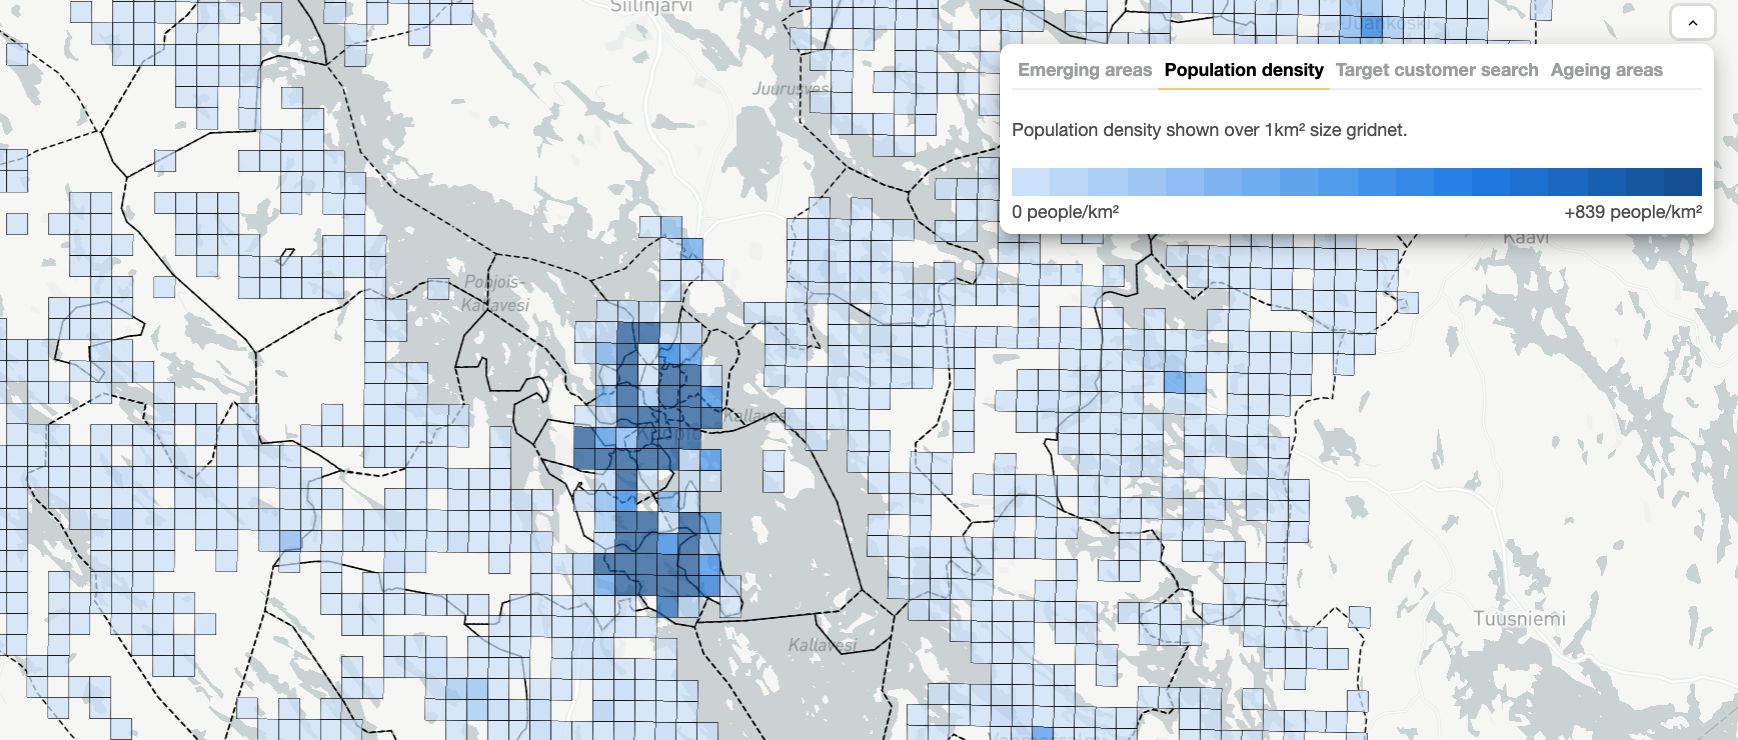
With CHAOS dashboards you can not only understand how people are located in an area but also what types of demographic and household they are. Moreover, you can explore in further details a particular demographic group, identify areas where this group is mostly represented, and understand how large it is in neighbouring areas.

2. Economic environment (unemployment rate and income level)
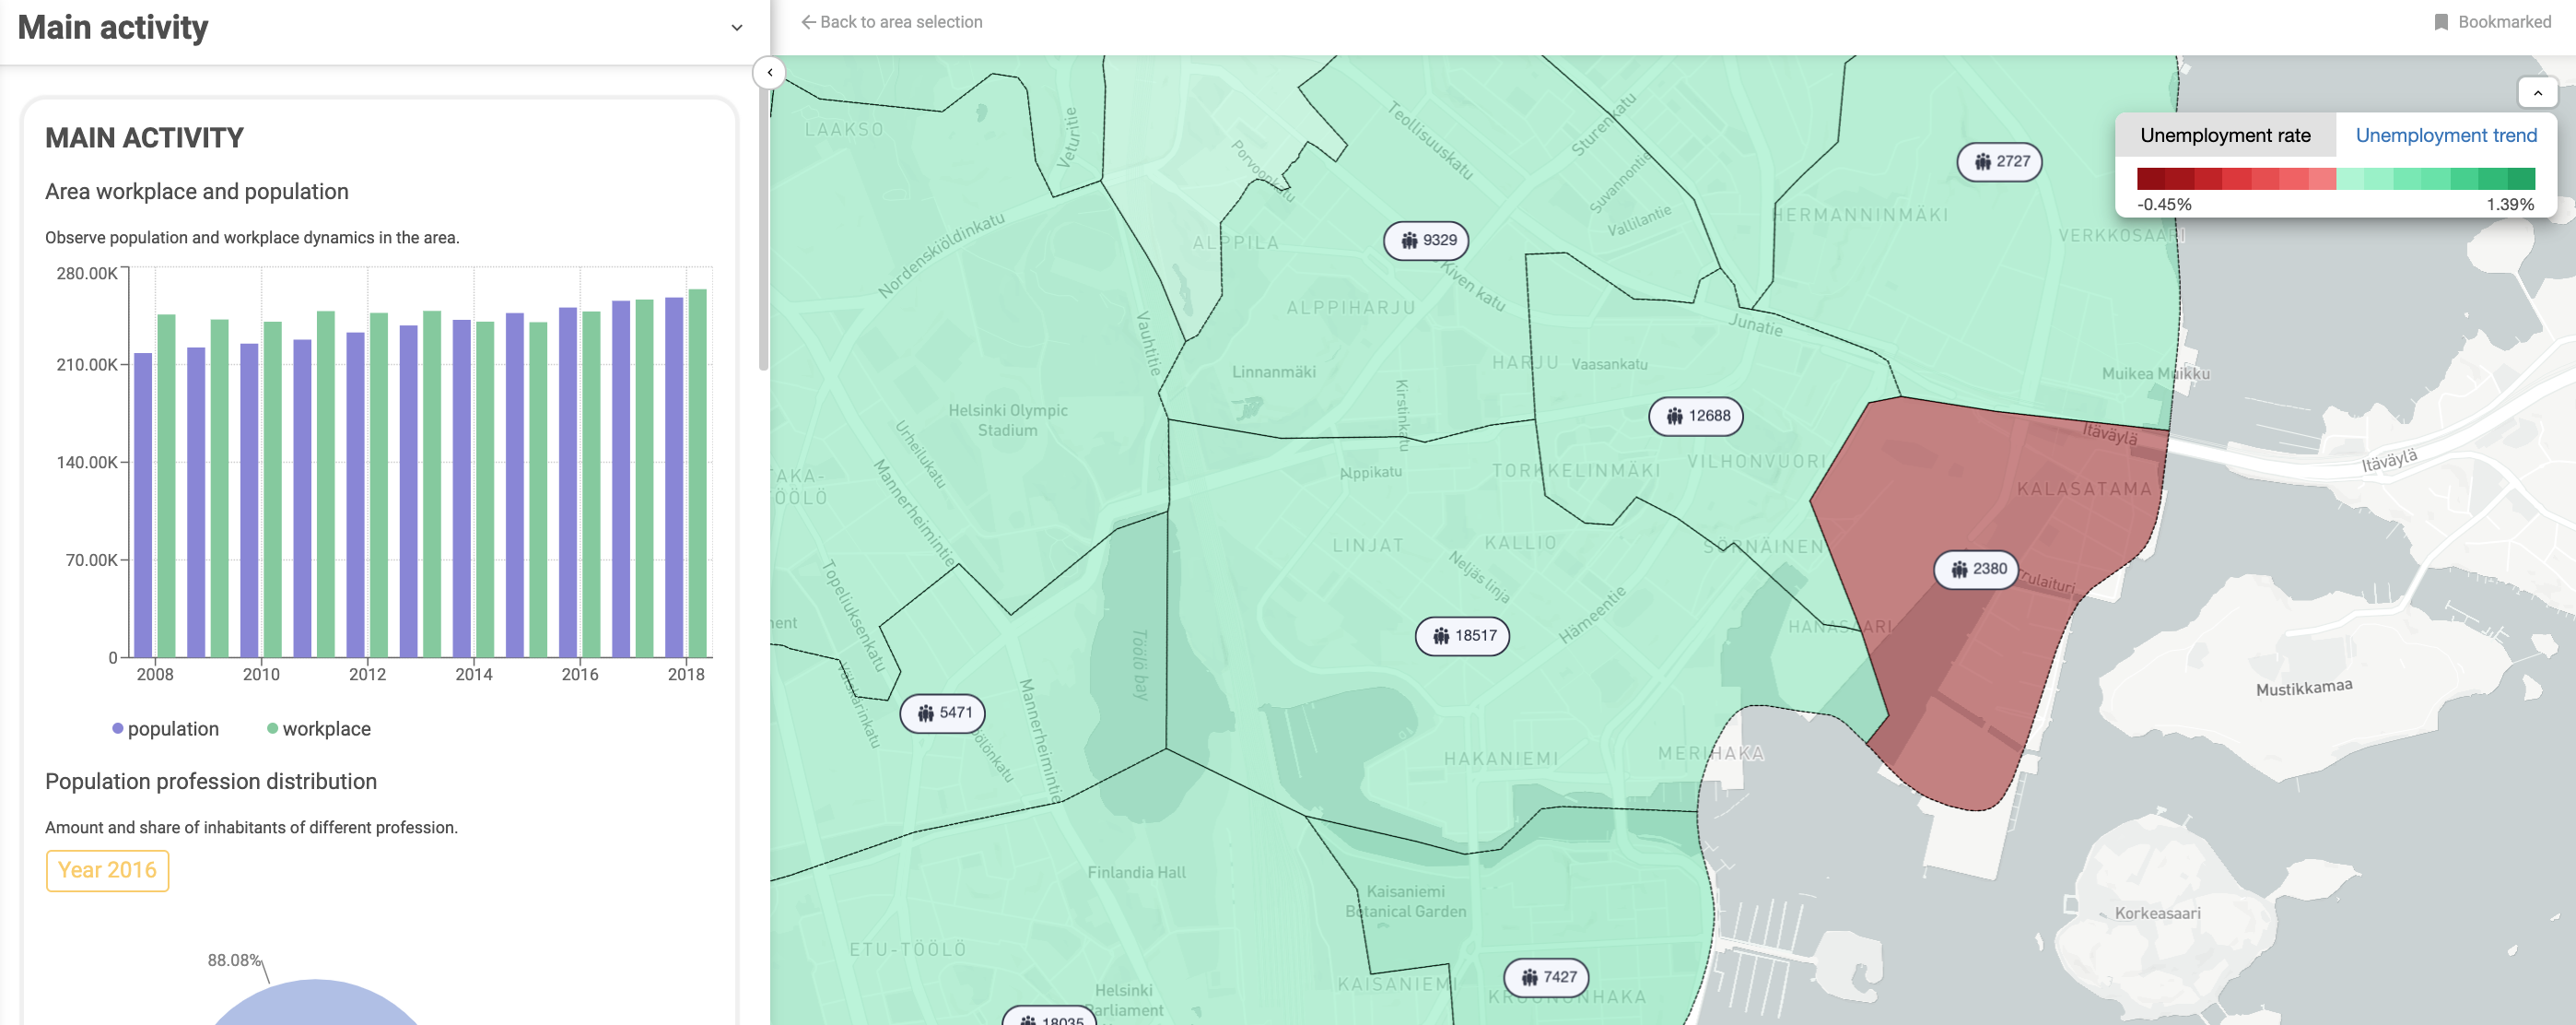
Unemployment and income levels are major factors that determine the "richness" of a specific location. A high-income area can indicate that its residents and those who want to become one have enough purchasing power to rent or buy high-class assets.
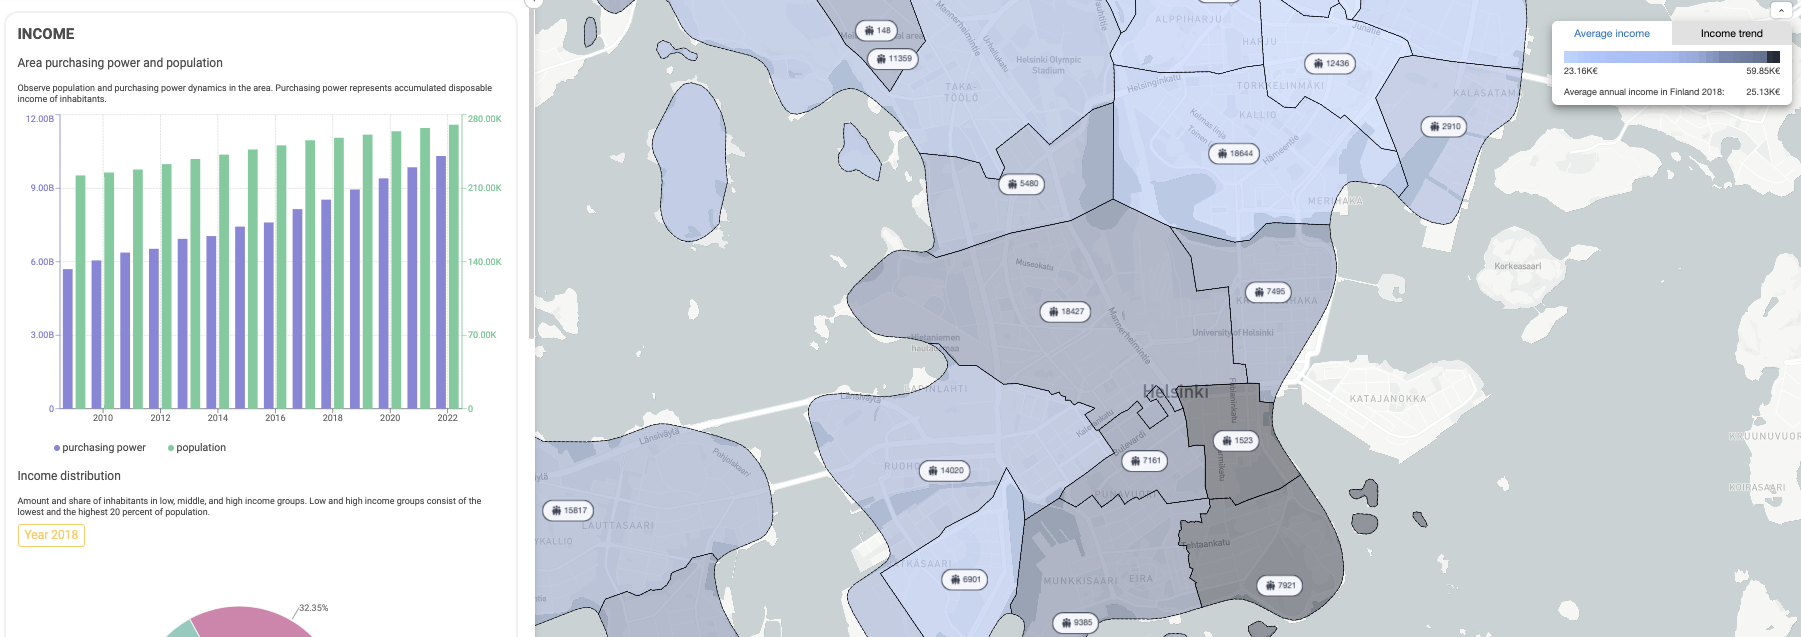
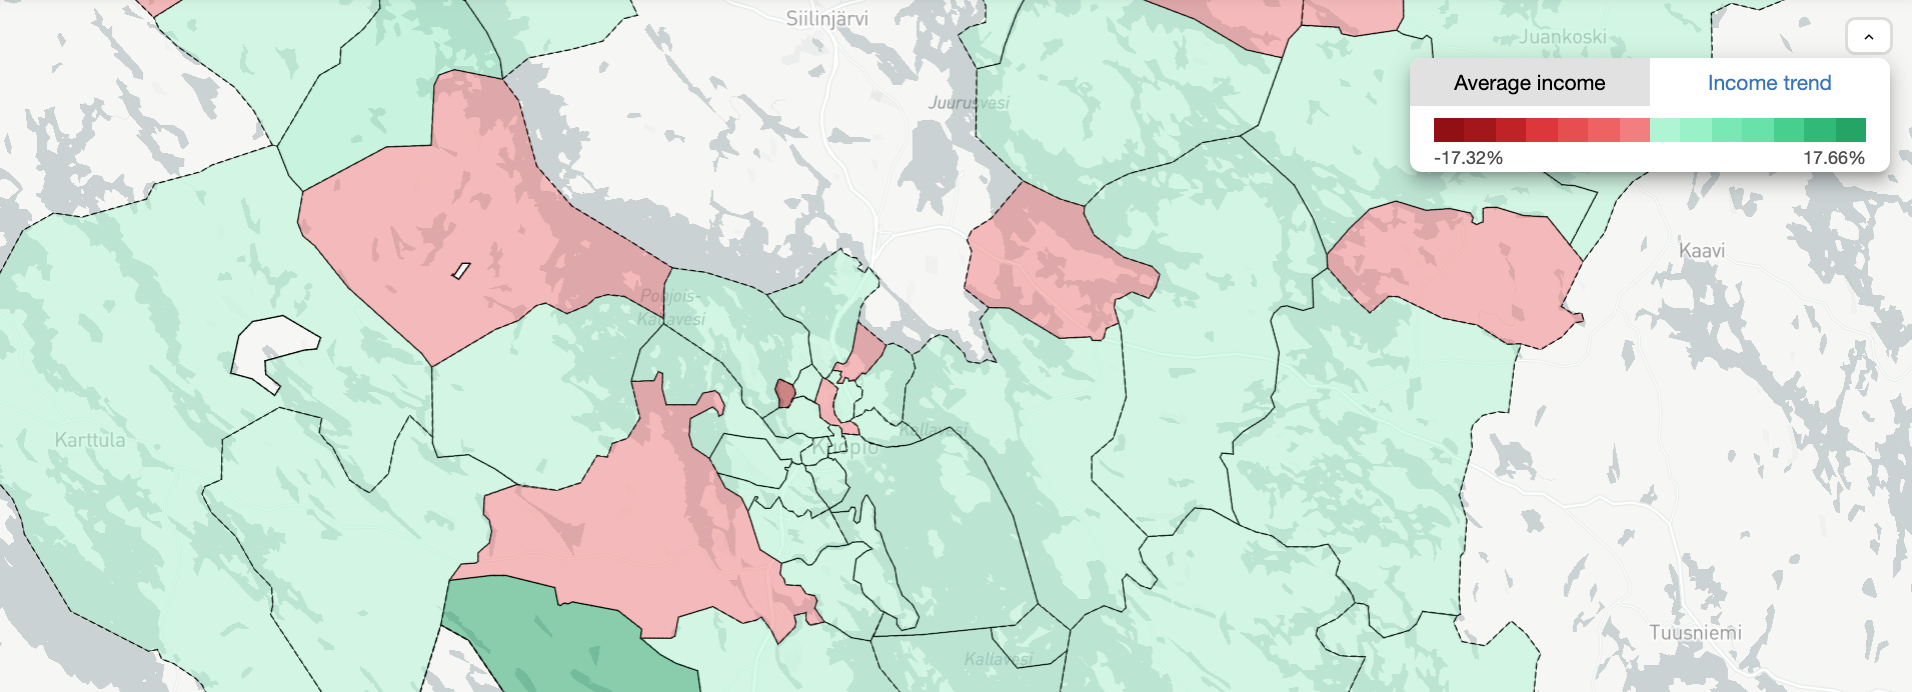
Income trends allow identifying areas that are becoming "rising stars", stagnating or losing attractiveness for high-income households. Available CHAOS forecasts can then help to plan cashflows and create investment plans.
3. Area investments (construction activities, types, mixed-use)
When making an investment decision, it is important to consider the balance between the forecasted demand and the building supply of a specific location. To get a full and accurate picture it is necessary to look at the past, present, and future building supply.
With CHAOS dashboard you can easily understand the past building supply - the existing building stock, in other words, discover how many buildings are there in an area, their types, and what kind of investments already exist in the area.


Additionally, CHAOS provides insights on the present building supply or the ongoing development, allowing you to see the number of new constructions, including repairs and renovations, that are being done currently in the area.
Moreover, by using the dashboard you can discover the future building supply, specifically how many new projects have been approved by the municipality that are not yet in construction and analyse how they fulfil the forecasted demand.
4. Market performance: rental prices
Market performance, ultimately, is the insight that provides the financial value to the area. This insight is generated by looking at the average value of the transactions in the market.
Detailed information about assets can also be obtained, and by uploading your own data, you can estimate more accurate transaction information.
5. Location benefits
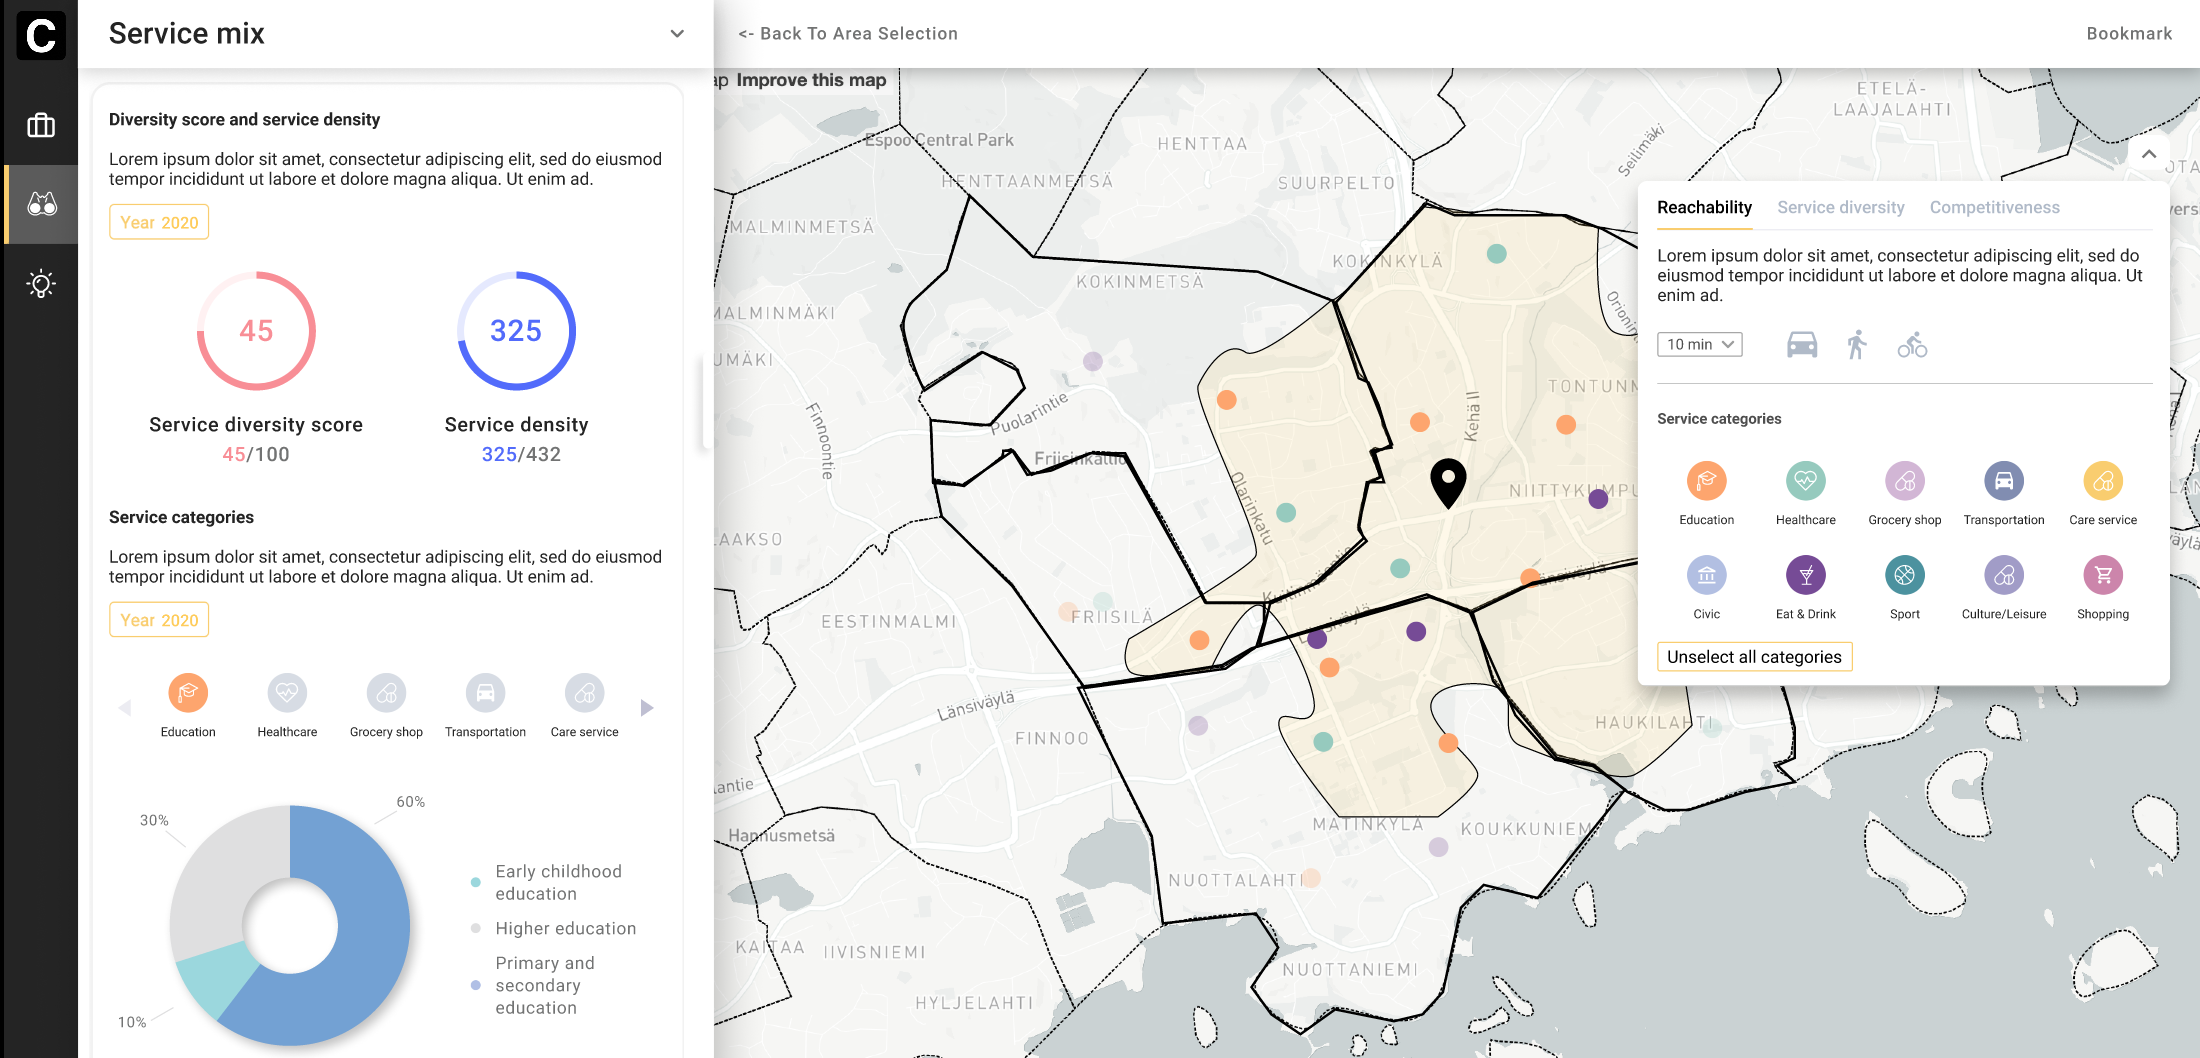
For a long time, the location benefits have been considered as "nice to have" elements. However, studies show that good transportation options and rich service provision are among others factors that can raise the market value of an area. By using CHAOS Service Mix dashboard, you can quickly evaluate the area's service diversity and service density, and consider the findings in your investment decision.
.png?width=337&name=image%20(6).png)
Conclusions
CHAOS multiple dashboards support your market analysis in residential investment decisions and provide a quick yet detailed view of an area and its investment opportunities. Moreover, CHAOS offers easily accessible city forecasting solutions for a range of demographic indicators.
Overall, CHAOS dashboards can be used in multiple and flexible scenarios to perform market analysis with high-quality data. If you want to learn more about other cases where CHAOS dashboards can be applied, please contact us or otherwise book a free demo.

